Updated: 05 Dec, 2024
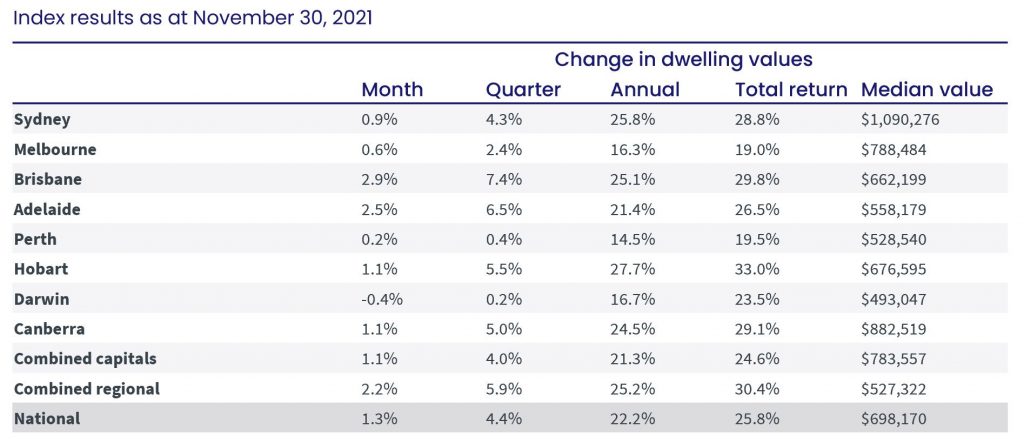
CoreLogic data shows housing values moved 1.3% higher in November 2021. This is the 14th consecutive month of positive growth. National housing values are 22.2% higher over the past 12 months. The rise adds approximately $126,700 to the median value of an Australian home.

CoreLogic Home Value Index November 2021
Figure: CoreLogic Home Value Index, November 2021
However, the pace of growth in November was the slowest since January.
CoreLogic research director Tim Lawless explains, “Virtually every factor that has driven housing values higher has lost some potency over the recent months. Fixed mortgage rates are rising, higher listings are taking some urgency away from buyers, affordability has become a more substantial barrier to entry and credit is less available.”
Thinking of buying a home?
Learn how to buy a house and avoid costly mistakes in under 2 hours.
LEARN MOREWhat Happened To The Property Market In November 2021?
- The monthly pace of capital gains in regional Australia accelerated over the past three months. Housing values for regional areas were up 2.2%.
- Regional standouts, from a capital growth perspective, were regional NSW and regional Tasmania, with monthly growth rates of 2.4% and 2.5%, respectively.
- NSW’s Southern Highlands and Shoalhaven recorded the highest quarterly growth of 9.7%, followed by Hunter Valley (excluding Newcastle) at 8.9%, and Tasmania’s Launceston and North East region at 7.7%.
- Different supply dynamics created divergent trends across capital cities. In the four weeks to 28 November 2021, the total stock for sale was 32% lower than the five-year average. However, Sydney’s stock levels were 2.6% below the average, while Melbourne’s were 7.9% above the average.
- Houses were still outperforming units. A capital city house was about $240,500 more than a capital city unit. The gap was higher in Sydney, where a house cost $523,000 more than a unit. Based on median values, capital city houses were 37.9% more expensive than units.
- The rise in the number of homes available for sale slowed capital growth. Nationally, the number of new listings added to the market over the four weeks ending 28 November was tracking 15.7% higher than the five-year average. This was the highest number since 2015.
- The total number of active listings has increased by 67.3% since early September, but stock levels remained 24.0% below the five-year average for this time of the year.
- It took longer to sell a home and auction clearance rates were trending lower. Capital-city homes were seeing median time on the market of up to 25 days. The weighted average for auction clearance rates in capital cities fell from the low 80% range in early October to the low 70% range in November.
- Rental growth was above the decade-average monthly movement of 0.2%. The monthly change in national rents was again between 0.6% and 0.7%.
- Gross rental yields fell to a record low of 3.23%. This implies a growing imbalance between the costs of owning a home and renting one.
What Will Happen To The Property Market In 2022?
The factors that pushed property prices higher in 2021 have either diminished or ended.
- The low advertised inventory levels are slowly rising. An increase in supply means buyers have more choice and sellers will need to lower their pricing expectations.
- Even though fixed interest rates are rising, variable rates usually do not change unless there’s a change in the cash rate. The low variable rates will continue to support housing demand.
- Housing affordability will remain a challenge, so there could be more demand for higher-density housing options like units and townhouses.
- The Australian Prudential Regulation Authority might evoke tighter credit policies in the coming years, which would dampen demand for property.
Do not hold off your plans to buy a property if you’re ready. With tightening credit policies on the horizon, it can get harder to qualify for a mortgage. Our mortgage brokers are here to help you. Call us on 1300 889 743 or enquire online.


